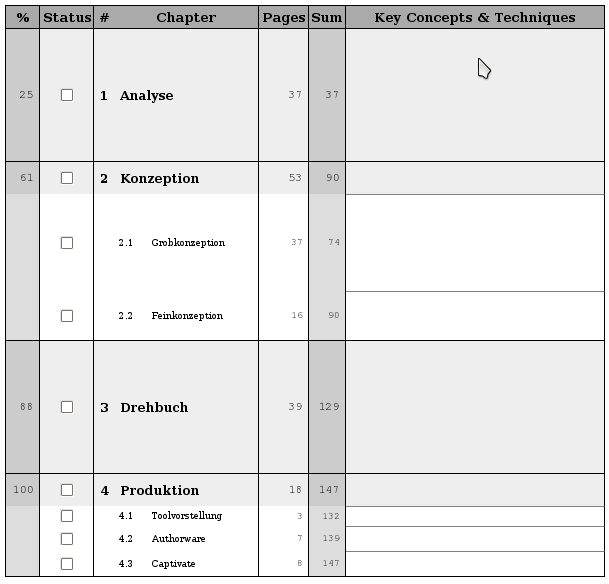
 The basic idea is, to have a table of the chapters, which have to be studied, their size and the overall percentage of progress after finishing it.
In the picture to the right I have posted a schedule which I created for my *eLearning* exam last year.
For this exam I had to study the production process for eLearning material.
The production process is constituted of four main entities: the *analysis* where we have to find out what should be accomplished by introducing an eLearning system, the *conception* where we create an initial prototype for the system which can be verified by the customer, the *screenplay* which describes the eLearning system in its entire detail, and finally the *production* where the system is implemented for shipping.
The plan provides me with the information of *how many slides* I have to read for each chapter.
It also provides an accumulated view, i.e. the *sum over all preceeding chapters*.
From this information we can calculate the *progress precentages*.
The progress percentages help measuring and auditing your performance.
Therefore, we also have a *status checkbox* to store your current progress.
When finishing a chapter, I usually mark it as checked.
Additionally, I write down the *key concepts and techniques*.
They are meant to give a quick overview over the chapter's contents and guide you through the details.
The basic idea is, to have a table of the chapters, which have to be studied, their size and the overall percentage of progress after finishing it.
In the picture to the right I have posted a schedule which I created for my *eLearning* exam last year.
For this exam I had to study the production process for eLearning material.
The production process is constituted of four main entities: the *analysis* where we have to find out what should be accomplished by introducing an eLearning system, the *conception* where we create an initial prototype for the system which can be verified by the customer, the *screenplay* which describes the eLearning system in its entire detail, and finally the *production* where the system is implemented for shipping.
The plan provides me with the information of *how many slides* I have to read for each chapter.
It also provides an accumulated view, i.e. the *sum over all preceeding chapters*.
From this information we can calculate the *progress precentages*.
The progress percentages help measuring and auditing your performance.
Therefore, we also have a *status checkbox* to store your current progress.
When finishing a chapter, I usually mark it as checked.
Additionally, I write down the *key concepts and techniques*.
They are meant to give a quick overview over the chapter's contents and guide you through the details.
After having designed these learning plans by hand for each course separately over the past years, I decided to implement and automation script. The idea was to define the learning plan in XML and transform the information to a printable layout via XSL. The language I used for specifying layouts is HTML. Alternatively, one could use XSL FO having the advantage of being able to generate PDF files directly. But HTML did the trick for now.
Here is now the XML code which was used for specifying the eLearning learn plan from above:

As you can see, I can specify the course and its structure in terms of chapters and sections. For chapters and sections I can provide information about the number of pages. These will be used for accumulation and percentage calculation. Finally, I specify the XML stylesheet which has to be applied as a XML processing instruction. This allows for opening the XML file in the browser directly and getting the layout displayed.
The stylesheet I cannot present in full length, as it covers around 150 lines of code. Most of the code is responsible for generating correct percentage number in different cases. Here is now a small excerpt:

What you should basically take from this code listing is, that an HTML document is generated on the fly. For generating this document, I have to do mainly percentage calculations. These have to be derived from accumulated sums and nested structures. If you are interested in the full code, just ask me. I can provide it later.
This was basically my technique for managing studies with a small tool chain which generates learning plans from XML descriptions. I hope you liked the presentation. Give me some feedback! Maybe there are some nice ways to improve this idea!